You know how to affect the exposure by controlling the aperture, shutter speed, and ISO, but how do you even know if your photo is “correctly” exposed?
Well, there’s really no such thing as a “correct” exposure but there is a visual reference that can help you read your image: a histogram.
Don’t skip this part! The sooner you learn how to use a histogram, the less frustrating everything else will be. Histograms can save you lots of time and guesswork during the shoot and after the shoot.
How to display the histogram
Before jumping into explaining what a histogram is, you should enable it on your camera. It’s much easier to see the effect of an aperture, shutter speed, or ISO adjustment on your histogram in real-time.
On some cameras, you can have a live histogram on the back of your screen as an overlay. On other cameras, you only see the histogram on playback.
Don’t trust your LCD screen for exposure
Why shouldn’t you just look at the LCD screen to see if the image is bright enough? Because sunlight, glare, and even the brightness of your LCD screen can affect how the image looks.
I look at the image on the LCD screen only to focus and check my composition, but I look at the histogram to check my exposure.
What’s a histogram?
A histogram is basically a graphical representation that shows how much of the image contains blacks, shadows, midtones, highlights, and whites from left to right. The higher the peaks in that zone, the more of that tone is present in the photo.
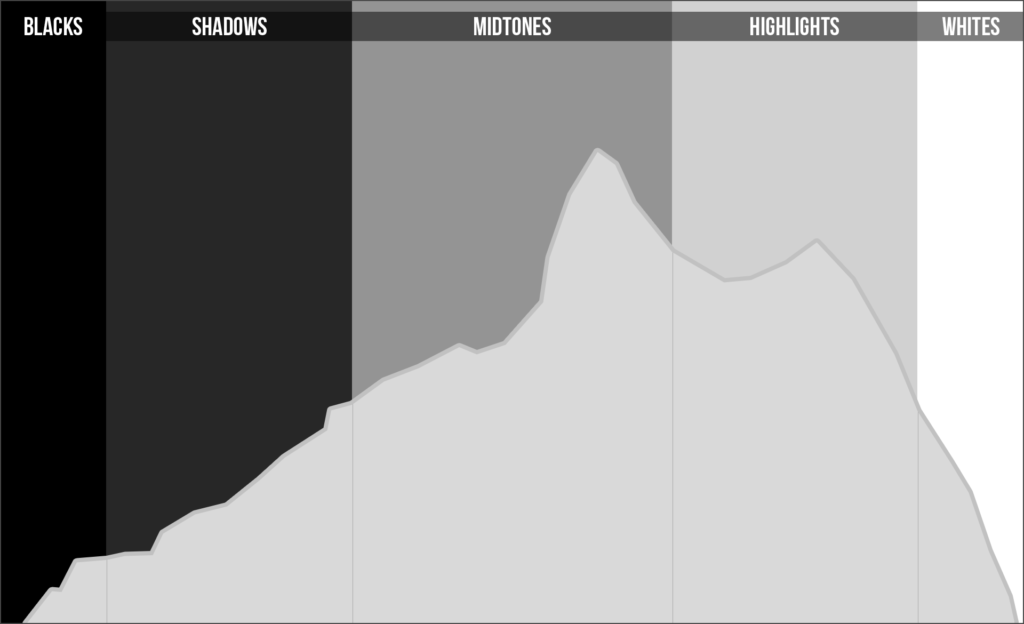
The histogram above has a distribution across the tonal range and drops off a little bit before the edges. It’s these edges that I pay most attention to when assessing exposure during the shoot. I tend to ignore the rest.
In many cases, I don’t want the graph to be bunched up on one side with no peaks on the other side because that means the image is likely underexposed or overexposed.
Underexposed
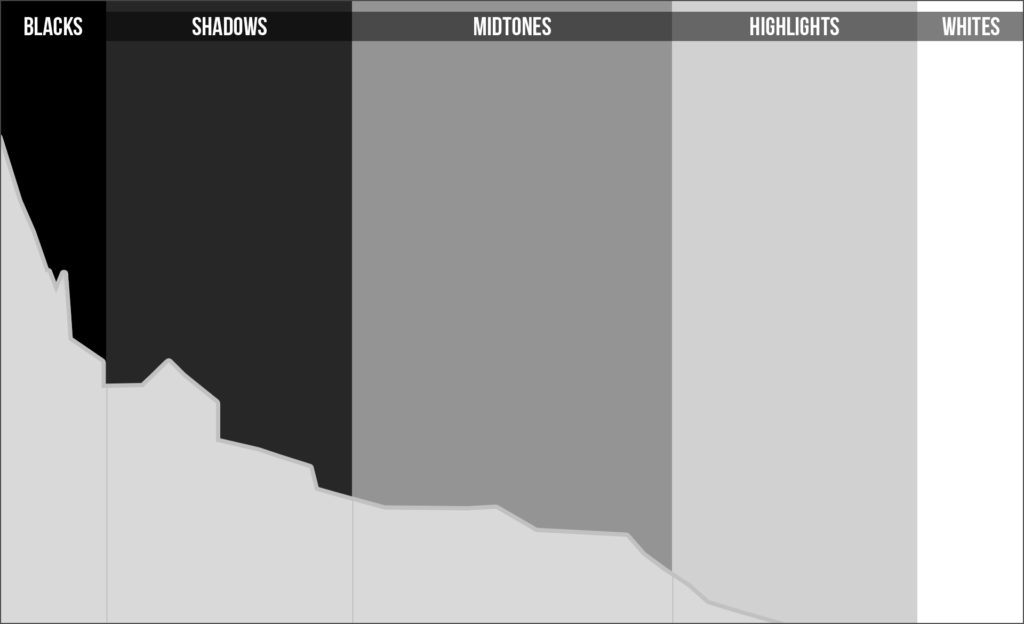
The histogram above shows that the image is likely underexposed. Most of the pixels are in the blacks and shadows, some in the midtones, and very little in the highlights. There are no whites at all.
There’s also a peak on the left side of the chart, where the blacks are. When that happens, that’s called “clipping” and that means that any details in that zone are lost. It’s just pure black.
If you try to increase the exposure in post, you risk having a lot of noise or grain in those areas. Try to avoid clipping the blacks.
To do that, you might use a wider aperture, a slower shutter speed, or a higher ISO to increase the exposure until the peak on the left side of the histogram is gone.
Overexposed
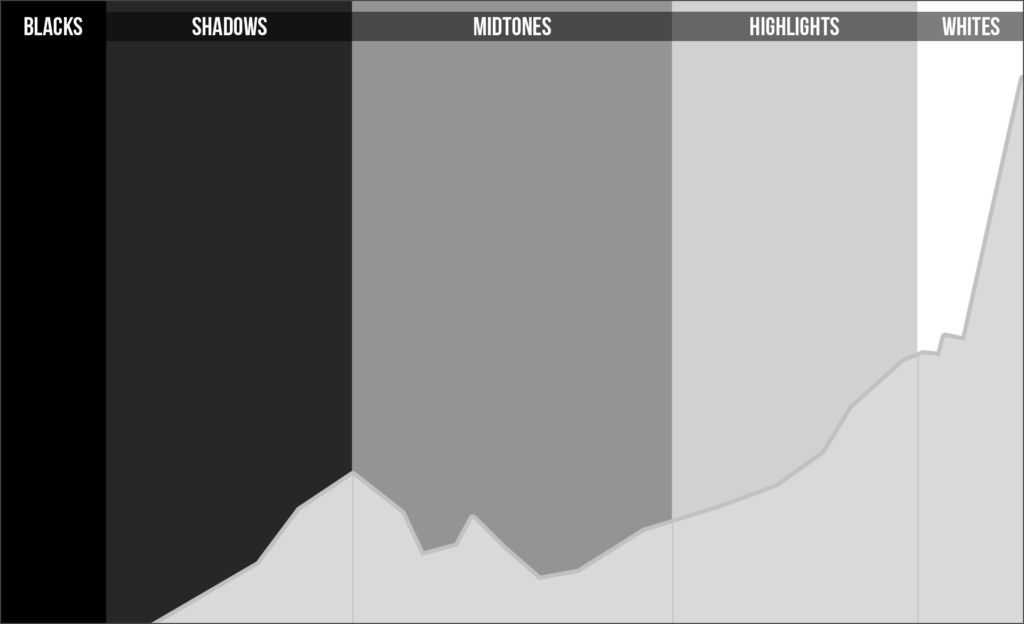
The histogram above shows that the image is likely overexposed. There are a lot of pixels to the right and the whites are clipped: there’s no detail at all in the brightest parts. You won’t be able to recover anything in those areas in editing.
There aren’t any blacks in the photo.
Use a smaller aperture, a faster shutter speed, or a lower ISO to decrease the exposure until the peak on the right side of the histogram goes away.
Reading a Histogram
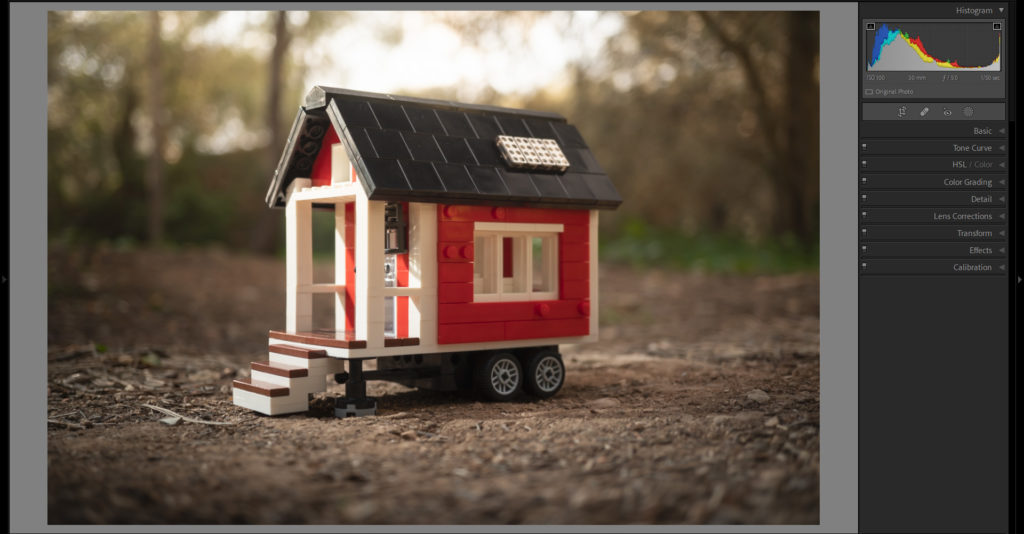
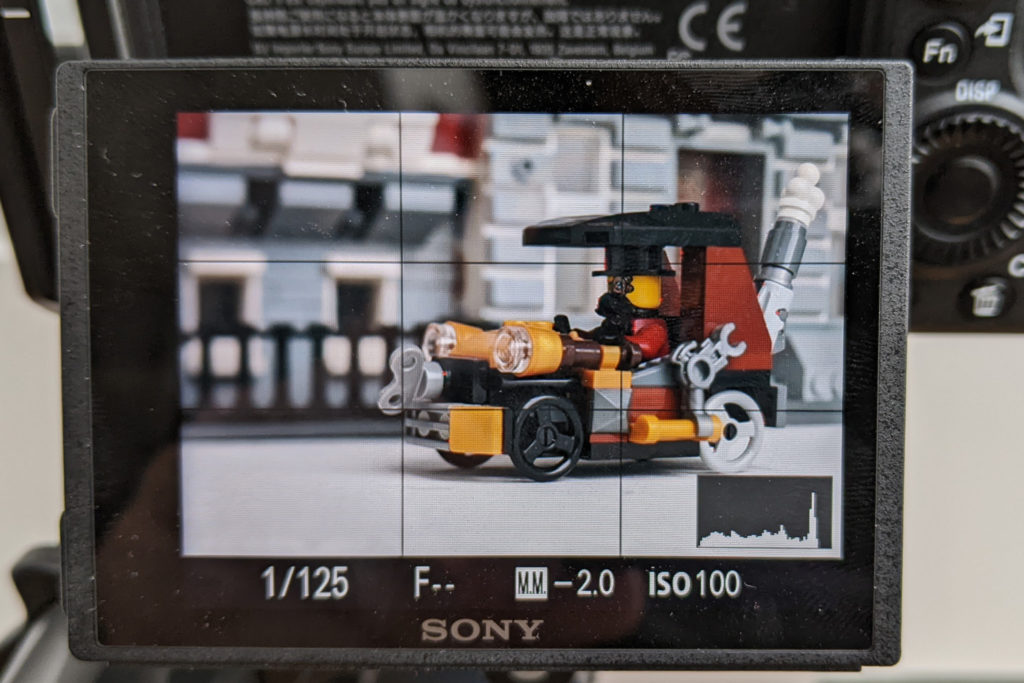
Here’s the histogram of the Iron Fist image below that we’ll use as an example. It was just some fun I was having with a minifig sent to me as a gag gift and not meant to be a great photo by any means, but it’ll do for this exercise.
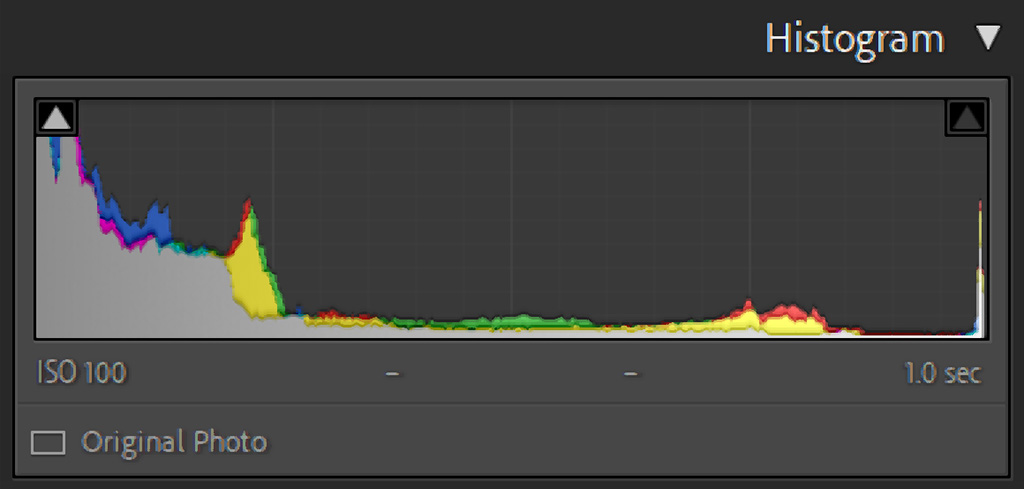
Since this is the histogram in Lightroom, it’s also showing the color information unlike the live view histogram on my camera which is grayscale. But they are essentially the same when looking at it for exposure.
Here’s how I would read this:
Most of the pixels are on the left side of the histogram–the blacks and shadows–so this is a predominantly dark photo.
Still looking at just the left side, the graph is pushed up against the edge, so that means there is lost detail in the blacks.
Moving right, there’s little distribution through the midtones and then there’s a little mountain range in the highlights. On the far right of the histogram, the sharp spike is pushed up against the edge which means the whites are clipped. Uh-oh.
So there’s a lot of pixels in the darkest areas, not many pixels in the midtones, then spikes of pixels in the highlights and whites. Conclusion: that’s a high-contrast photo with some exposure problems.
You can see where the crushed blacks and blown highlights are with the clipping indicators turned on, blue for clipped blacks and red for clipped whites:
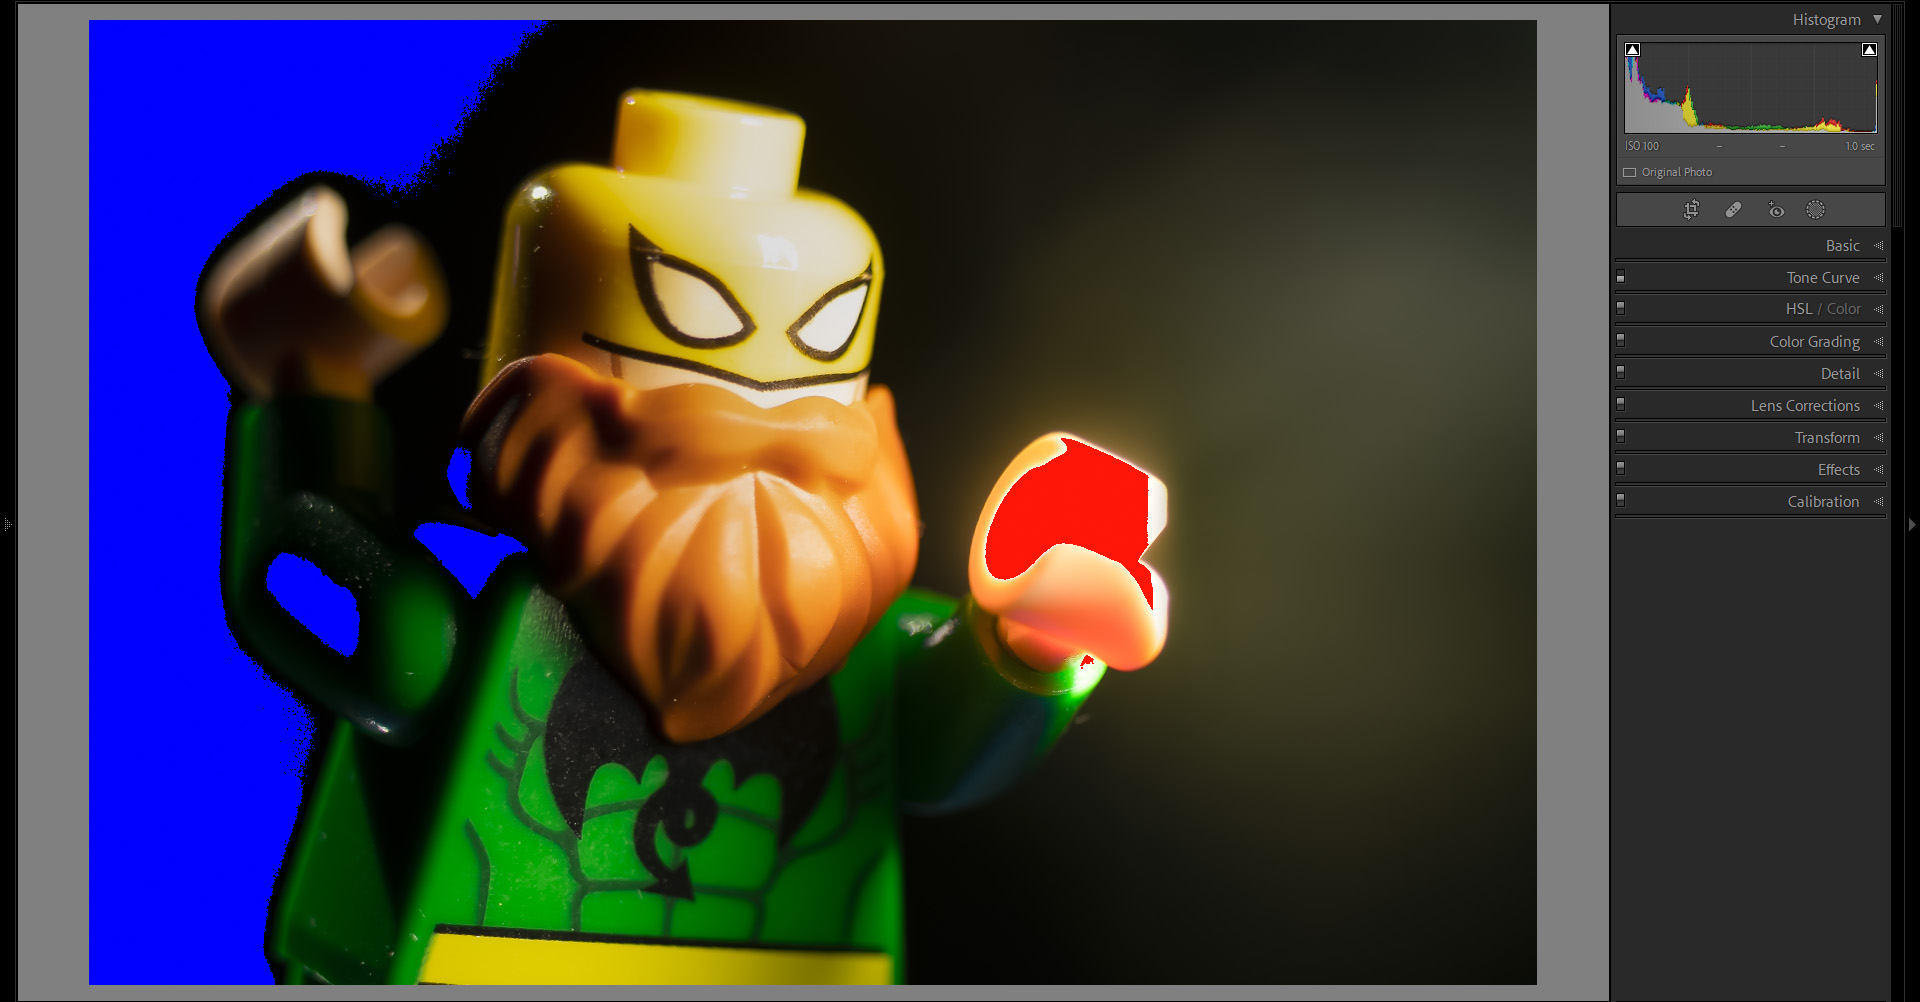

Those areas highlighted have no detail at all in them: they are just pure black and pure white.
I could try to push up the blacks and shadows and then bring down the whites and highlights in Lightroom so they are no longer clipped. I’d get a less contrasty photo with some detail in the dark areas:
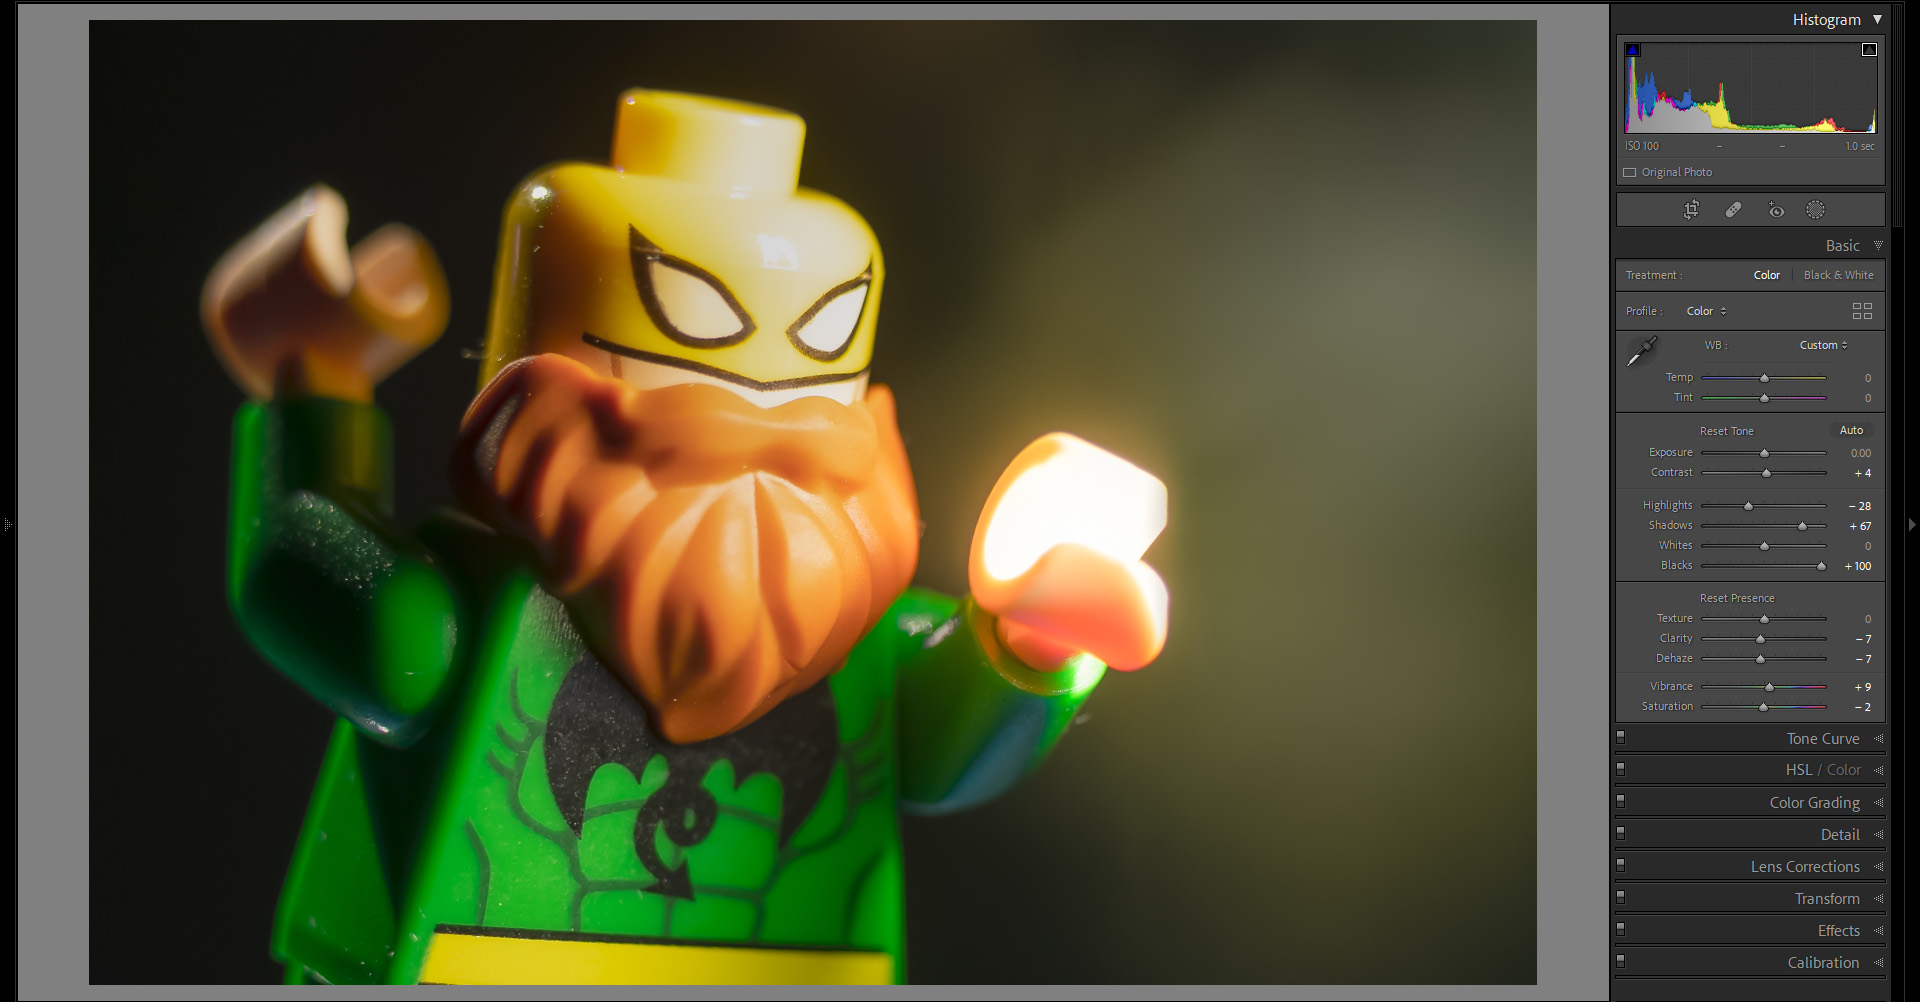
Have a look at the histogram before and after the adjustments to see how they changed the shape of it. More information was distributed from the dark tones to the midtones.
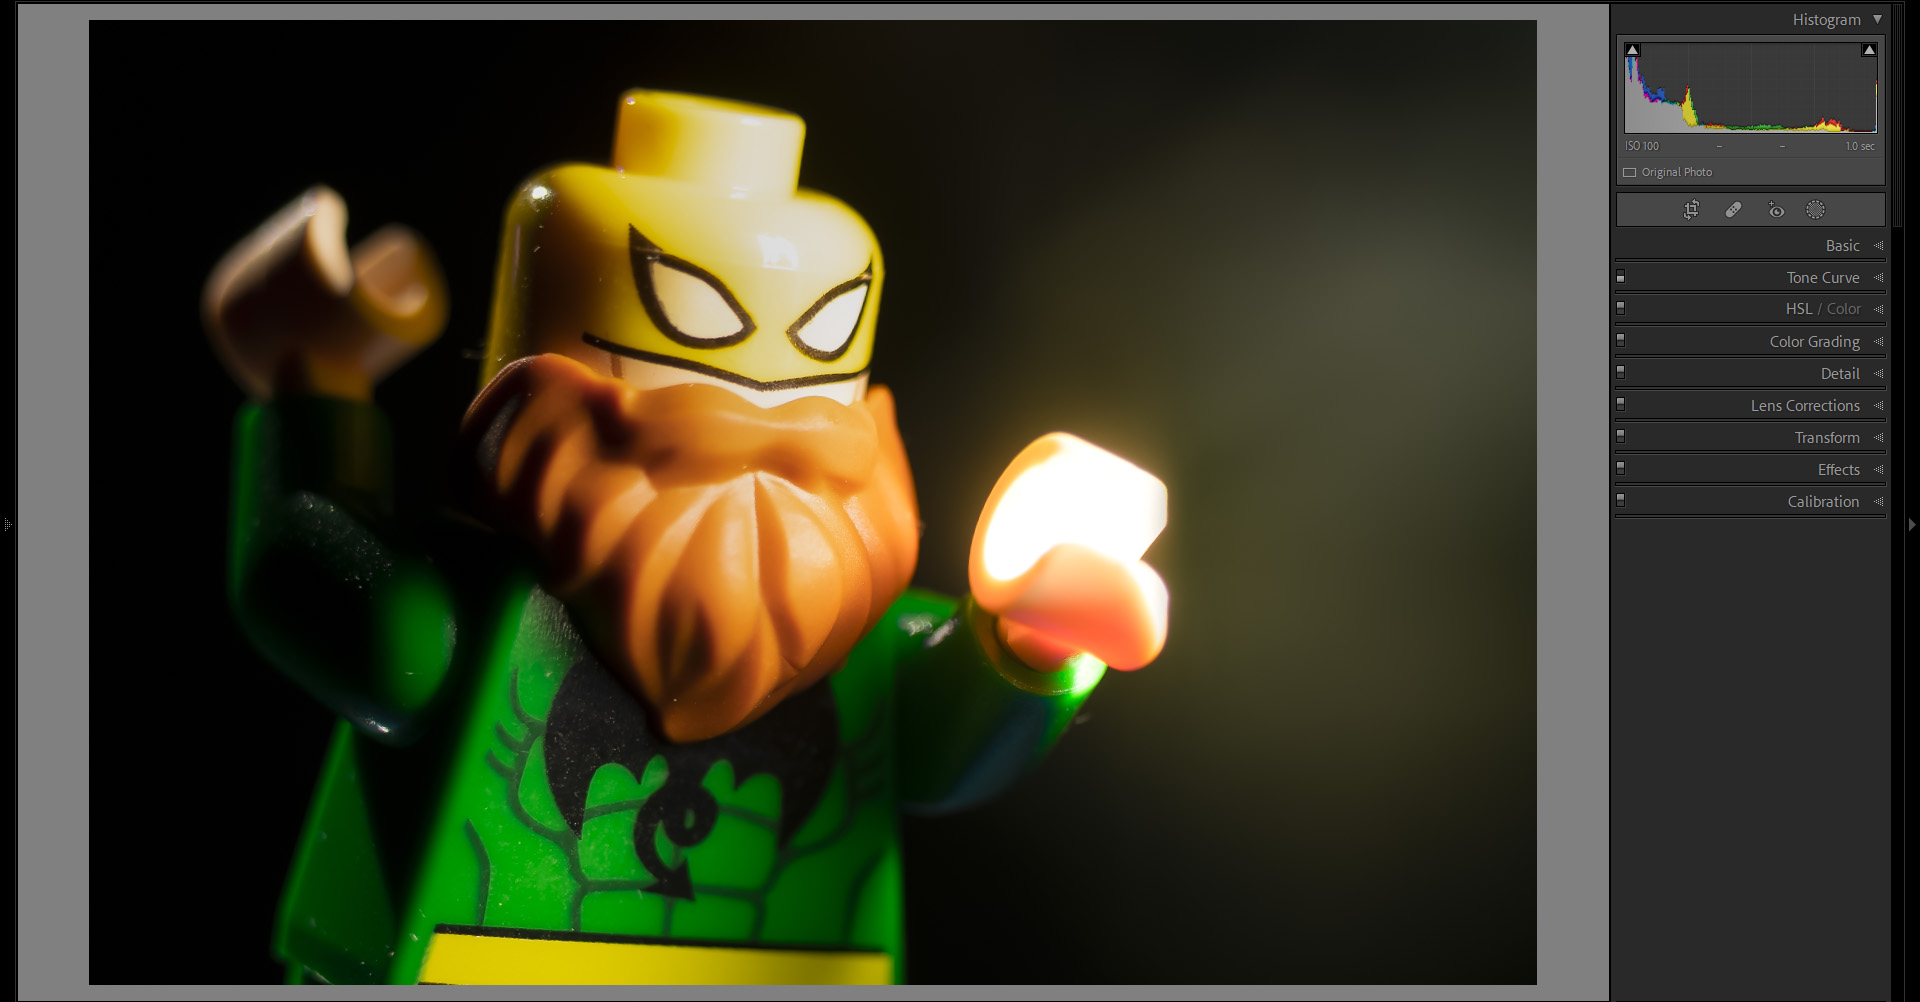
It’s much harder to bring back anything in the blown-out hand though as dropping the whites just makes it a muddy gray.
But perhaps it’s ok to have the hand super bright since Iron Fist is channeling all of his chi into it! That’s a creative choice I can make even though it would mean having an “error” in my photo.
Histograms are guides
When you fully understand exposure and how to read the histogram, you can break the rules and intentionally underexpose or overexpose an image to create a mood, a look, or an effect.
If you want to “crush the blacks” to make the image feel moodier or “blow out the highlights” to make the image feel lighter, you can! But do so with intention.
Download my free toy photography cheatsheets